The previous chapters summarized bivariate data that we observed. This chapter develops the theoretical counterpart: the bivariate random vector and its joint, marginal, and conditional distributions. Just as a single random variable has a theoretical mean and variance, a pair \((X_{i}, Y_{i})\) has a theoretical covariance, correlation, and regression coefficient.
Theoretical Distributions
To talk about what sample statistics estimate, we need a theoretical counterpart to the bivariate observations of the previous chapters.
A random vector \((X_{i}, Y_{i})\) is a pair of random variables drawn together. It is the population analog of one paired observation \((\hat{X}_{i}, \hat{Y}_{i})\): same structure, but described before the data exist.
The random vector is useful as the formal object that the empirical pair \((\hat{X}_{i}, \hat{Y}_{i})\) samples from. For example, if we are going to flip two coins, then \((X_{i}, Y_{i})\) corresponds to the unflipped coins and \((\hat{X}_{i}, \hat{Y}_{i})\) to the concrete outcomes once they are flipped. Each sample-level object from earlier chapters (\(\hat{p}_{xy}\), \(\hat{C}_{XY}\), \(\hat{R}_{XY}\), \(\hat{b}_{1}\)) has a population counterpart defined at the level of the random vector.
Definitions for Discrete Data.
For discrete random variables, the starting point is the table of probabilities for every possible pair of values.
The joint probability of two discrete random variables is the probability that both events \(X_{i}=x\) and \(Y_{i}=y\) occur: \[Prob(X_{i} = x, Y_{i} = y).\] The joint distribution is the table of these probabilities over all pairs \((x, y)\), summing to one.
The joint probability is useful as the theoretical version of the empirical joint distribution \(\hat{p}_{xy}\) from Bivariate Distributions: the same table structure, but with population probabilities in place of sample proportions. With enough draws, \(\hat{p}_{xy}\) approaches the joint distribution.
A particularly simple special case is when the two variables carry no information about each other.
Two random variables are statistically independent when the joint probability factors as the product of the marginals: \[Prob(X_{i}=x, Y_{i}=y)=Prob(X_{i}=x)Prob(Y_{i}=y) \quad \text{for every } (x, y).\] Equivalently, knowing \(Y_{i}\) tells you nothing about the distribution of \(X_{i}\).
Independence is useful as the cleanest baseline against which to compare real data: most of the dependence statistics in Statistics of Association take value zero when the variables are independent. Independence is sometimes assumed for mathematical simplicity, not because it generally fits data well.
The marginal distributions are then defined as \[\begin{eqnarray}
Prob(X_{i} = x) = \sum_{y} Prob(X_{i} = x | Y_{i} = y) Prob( Y_{i} = y ) \\
Prob(Y_{i} = y) = \sum_{x} Prob(Y_{i} = y | X_{i} = x) Prob( X_{i} = x ),
\end{eqnarray}\] which is also known as the law of total probability.
The conditional distributions are defined as \[\begin{eqnarray}
Prob(X_{i} = x | Y_{i} = y) = \frac{ Prob(X_{i} = x, Y_{i} = y)}{ Prob( Y_{i} = y )}\\
Prob(Y_{i} = y | X_{i} = x) = \frac{ Prob(X_{i} = x, Y_{i} = y)}{ Prob( X_{i} = x )}
\end{eqnarray}\]
Coin Flips Example.
For one example, Consider flipping two coins, where we mark whether “heads” is face up with a \(1\) and “tail” with a \(0\). E.g., the first coin has a value of \(x=1\) if it shows heads and \(x=0\) if it shows tails. This table shows both the joint distribution and also each marginal distribution.
| \(y=0\) |
\(Prob(X_{i}=0,Y_{i}=0)\) |
\(Prob(X_{i}=1,Y_{i}=0)\) |
\(Prob(Y_{i}=0)\) |
| \(y=1\) |
\(Prob(X_{i}=0,Y_{i}=1)\) |
\(Prob(X_{i}=1,Y_{i}=1)\) |
\(Prob(Y_{i}=1)\) |
| Marginal |
\(Prob(X_{i}=0)\) |
\(Prob(X_{i}=1)\) |
\(1\) |
Note that different joint distributions can have the same marginal distributions.
Suppose both coins are “fair”: \(Prob(X_{i}=1)= 1/2\) and \(Prob(Y_{i}=1|X_{i}=x)=1/2\) for either \(x=1\) or \(x=0\), then the four potential outcomes have equal probabilities. \[\begin{eqnarray}
Prob(X_{i} = 0, Y_{i} = 0) &=& 1/2 \times 1/2 = 1/4 \\
Prob(X_{i} = 0, Y_{i} = 1) &=& 1/4 \\
Prob(X_{i} = 1, Y_{i} = 0) &=& 1/4 \\
Prob(X_{i} = 1, Y_{i} = 1) &=& 1/4 .
\end{eqnarray}\] The joint distribution is written generally as \[\begin{eqnarray}
Prob(X_{i} = x, Y_{i} = y) &=& Prob(X_{i} = x) Prob(Y_{i} = y).
\end{eqnarray}\]
Code
# Create a 2x2 matrix for the joint distribution.
# Rows correspond to X (coin 1), and columns correspond to Y (coin 2).
probs <- c(0.25, 0.25, 0.25, 0.25) # Fair coin
P_xy <- matrix( probs, nrow = 2, ncol = 2)
rownames(P_xy) <- c('Y=0', 'Y=1')
colnames(P_xy) <- c('X=0', 'X=1')
P_xy
##      X=0  X=1
## Y=0 0.25 0.25
## Y=1 0.25 0.25

# Draw N bivariate observations
N <- 500
xy_vals <- expand.grid(y = 0:1, x = 0:1)
draws <- sample(nrow(xy_vals), N, replace = TRUE, prob = P_xy)
x_draw <- xy_vals[draws, 'x']
y_draw <- xy_vals[draws, 'y']

# With enough draws, empirical frequencies approach the true probabilities
table(y_draw, x_draw) / N
##       x_draw
## y_draw     0     1
##      0 0.226 0.278
##      1 0.224 0.272
P_xy
##      X=0  X=1
## Y=0 0.25 0.25
## Y=1 0.25 0.25
The marginal distribution of the second coin is \[\begin{eqnarray}
Prob(Y_{i} = 0) &=& Prob(Y_{i} = 0 | X_{i} = 0) Prob(X_{i}=0) + Prob(Y_{i} = 0 | X_{i} = 1) Prob(X_{i}=1)\\
&=& 1/2 (1/2) + 1/2 (1/2) = 1/2\\
Prob(Y_{i} = 1) &=& Prob(Y_{i} = 1 | X_{i} = 0) Prob(X_{i}=0) + Prob(Y_{i} = 1 | X_{i} = 1) Prob(X_{i}=1)\\
&=& 1/2 (1/2) + 1/2 (1/2) = 1/2
\end{eqnarray}\]
The marginal distribution of the first coin is found in the exact same way \[\begin{eqnarray}
Prob(X_{i} = 0) &=& Prob(X_{i} = 0 | Y_{i} = 0) Prob(Y_{i}=0) + Prob(X_{i} = 0 | Y_{i} = 1) Prob(Y_{i}=1)\\
&=& 1/2 (1/2) + 1/2 (1/2) = 1/2\\
Prob(X_{i} = 1) &=& Prob(X_{i} = 1 | Y_{i} = 0) Prob(Y_{i}=0) + Prob(X_{i} = 1 | Y_{i} = 1) Prob(Y_{i}=1)\\
&=& 1/2 (1/2) + 1/2 (1/2) = 1/2
\end{eqnarray}\]
Altogether, we find
| \(y=0\) |
\(1/4\) |
\(1/4\) |
\(1/2\) |
| \(y=1\) |
\(1/4\) |
\(1/4\) |
\(1/2\) |
| Marginal |
\(1/2\) |
\(1/2\) |
\(1\) |
Code
# Compute the marginal distributions.
# Marginal for X: sum across columns.
P_x <- colSums(P_xy)
P_x
## X=0 X=1
## 0.5 0.5
# Marginal for Y: sum across rows.
P_y <- rowSums(P_xy)
P_y
## Y=0 Y=1
## 0.5 0.5

# Compute the conditional probabilities Prob(Y | X).
PY_x <- matrix(0, nrow = 2, ncol = 2)
for (j in c(1, 2)) {
  PY_x[, j] <- P_xy[, j] / P_x[j]
}
rownames(PY_x) <- c('Y=0', 'Y=1')
colnames(PY_x) <- c('given X=0', 'given X=1')
PY_x
##     given X=0 given X=1
## Y=0       0.5       0.5
## Y=1       0.5       0.5
Are the coins statistically independent?
Now consider a second example, where the second coin is “Completely Unfair”, so that it is always the same as the first. The outcomes generated with a Completely Unfair coin are the same as if we only flipped one coin. \[\begin{eqnarray}
Prob(X_{i} = 0, Y_{i} = 0) &=& 1/2 \\
Prob(X_{i} = 0, Y_{i} = 1) &=& 0 \\
Prob(X_{i} = 1, Y_{i} = 0) &=& 0 \\
Prob(X_{i} = 1, Y_{i} = 1) &=& 1/2 .
\end{eqnarray}\] The joint distribution is written generally as \[\begin{eqnarray}
Prob(X_{i} = x, Y_{i} = y) &=& Prob(X_{i} = x) \mathbf{1}( x=y ),
\end{eqnarray}\] where \(\mathbf{1}(x=y)\) equals \(1\) when \(x=y\) and \(0\) otherwise. The marginal distribution of the second coin is \[\begin{eqnarray}
Prob(Y_{i} = 0)
&=& Prob(Y_{i} = 0 | X_{i} = 0) Prob(X_{i}=0) + Prob(Y_{i} = 0 | X_{i} = 1) Prob(X_{i} = 1)\\
&=& 1 (1/2) + 0(1/2) = 1/2 .\\
Prob(Y_{i} = 1)
&=& Prob(Y_{i} = 1 | X_{i} =0) Prob( X_{i} = 0) + Prob(Y_{i} = 1 | X_{i} = 1) Prob( X_{i} = 1)\\
&=& 0 (1/2) + 1 (1/2) = 1/2 .
\end{eqnarray}\] which is the same marginal as in the first example!
The marginal distribution of the first coin is found in the exact same way (show this yourself).
Alltogether, we find
| \(y=0\) |
\(1/2\) |
\(0\) |
\(1/2\) |
| \(y=1\) |
\(0\) |
\(1/2\) |
\(1/2\) |
| Marginal |
\(1/2\) |
\(1/2\) |
\(1\) |
Code
# Create the joint distribution matrix for the unfair coin case.
probs <- c(0.5, 0, 0, 0.5) # unfair coin

P_xy <- matrix( probs, nrow = 2, ncol = 2)
rownames(P_xy) <- c('Y=0', 'Y=1')
colnames(P_xy) <- c('X=0', 'X=1')
P_xy
##     X=0 X=1
## Y=0 0.5 0.0
## Y=1 0.0 0.5


# Compute the marginal distributions.
# Marginal for X: sum across columns.
P_x <- colSums(P_xy)
P_x
## X=0 X=1
## 0.5 0.5
# Marginal for Y: sum across rows.
P_y <- rowSums(P_xy)
P_y
## Y=0 Y=1
## 0.5 0.5

# Compute the conditional probabilities Prob(Y | X).
PY_x <- matrix(0, nrow = 2, ncol = 2)
for (j in c(1, 2)) {
  PY_x[, j] <- P_xy[, j] / P_x[j]
}
rownames(PY_x) <- c('Y=0', 'Y=1')
colnames(PY_x) <- c('given X=0', 'given X=1')
PY_x
##     given X=0 given X=1
## Y=0         1         0
## Y=1         0         1
Are the coins statistically independent?
Try computing conditional probabilities for another unfair set of coins below. Explain why the marginal distribution of the second coin is balanced.
Code
probs <- c(0.4, 0.2, 0.1, 0.3)
P_xy <- matrix(probs, nrow = 2,
  dimnames = list(c('Y=0', 'Y=1'), c('X=0', 'X=1')))

# Draw N bivariate observations
xy_vals <- expand.grid(y = 0:1, x = 0:1)
N <- 500
draws <- sample(nrow(xy_vals), N, replace = TRUE, prob = P_xy)
x_draw <- xy_vals[draws, 'x']
y_draw <- xy_vals[draws, 'y']

table(y_draw, x_draw) / N
##       x_draw
## y_draw     0     1
##      0 0.354 0.102
##      1 0.202 0.342
P_xy
##     X=0 X=1
## Y=0 0.4 0.1
## Y=1 0.2 0.3
Definitions for Continuous Data.
The joint distribution is defined as \[\begin{eqnarray}
F(x, y) &=& Prob(X_{i} \leq x, Y_{i} \leq y)
\end{eqnarray}\] The marginal distributions are then defined as \[\begin{eqnarray}
F_{X}(x) &=& F(x, \infty)\\
F_{Y}(y) &=& F(\infty, y).
\end{eqnarray}\] which is also known as the law of total probability. Variables are statistically independent if \(F(x, y) = F_{X}(x)F_{Y}(y)\) for all \(x, y\).
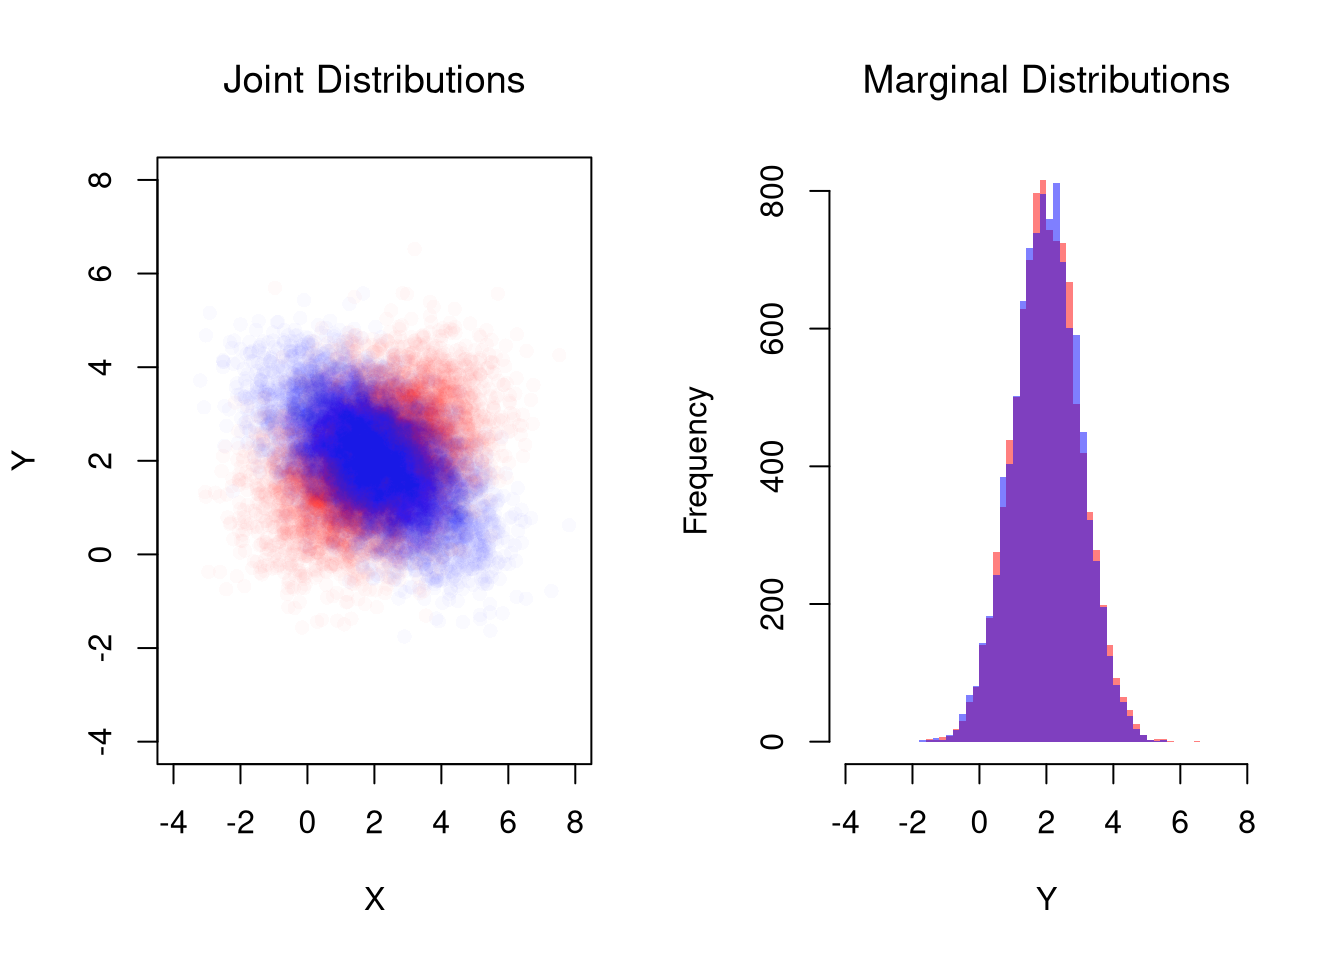
The most-used parametric joint distribution on continuous data is the bivariate analog of the Normal.
A bivariate normal distribution describes a random vector \((X_{i}, Y_{i})\) whose joint density is the multivariate normal with mean vector \((\mu_{X}, \mu_{Y})\), variances \((\sigma_{X}^{2}, \sigma_{Y}^{2})\), and correlation \(\rho\).
The bivariate normal is useful as a workhorse for analytical work on multivariate random variables: both marginals are normal, and every conditional \(Y_{i} \mid X_{i} = x\) is also normal with a linear conditional mean, so anything that worked for one Normal random variable extends to the pair.
Code
library(mvtnorm)

# Simulate Bivariate Data
N <- 10000
Mu <- c(2, 2) ## Means

Sigma1 <- matrix(c(2, -.8, -.8, 1), 2, 2) ## CoVariance Matrix 1
MVdat1 <- rmvnorm(N, Mu, Sigma1)
colnames(MVdat1) <- c('X', 'Y')

Sigma2 <- matrix(c(2, .4, .4, 1), 2, 2) ## CoVariance Matrix 2
MVdat2 <- rmvnorm(N, Mu, Sigma2)
colnames(MVdat2) <- c('X', 'Y')

par(mfrow=c(1, 2))
## Different diagonals
plot(MVdat2, col=rgb(1, 0, 0, 0.02), pch=16,
    main=NA,
    ylim=c(-4, 8), xlim=c(-4, 8),
    xlab='X', ylab='Y')
title('Joint Distributions', font.main=1)
points(MVdat1, col=rgb(0, 0, 1, 0.02), pch=16)
## Same marginal distributions
xbks <- seq(-4, 8, by=.2)
hist(MVdat2[, 2], col=rgb(1, 0, 0, 0.5),
    breaks=xbks, border=NA, freq=FALSE,
    xlab='Y',
    main=NA)
title('Marginal Distributions', font.main=1)
hist(MVdat1[, 2], col=rgb(0, 0, 1, 0.5),
    add=TRUE, breaks=xbks, border=NA, freq=FALSE)
Code
# See that independent data are a special case
n <- 2e4
## 2 Indepenant RV
XYiid <- cbind( rnorm(n),  rnorm(n))
## As a single Joint Draw
XYjoint <- mvtnorm::rmvnorm(n, c(0, 0))
## Plot
par(mfrow=c(1, 2))
plot(XYiid,
    col=grey(0, .05), pch=16, xlim=c(-5, 5), ylim=c(-5, 5))
plot(XYjoint,
    col=grey(0, .05), pch=16, xlim=c(-5, 5), ylim=c(-5, 5))

# Compare densities
#d1 <- dnorm(XYiid[, 1], 0)*dnorm(XYiid[, 2], 0)
#d2 <- mvtnorm::dmvnorm(XYiid, c(0, 0))
#head(cbind(d1, d2))
Other joint distributions exist; see e.g., https://cran.r-project.org/web/packages/NonNorMvtDist/NonNorMvtDist.pdf.
Statistics
Conditional Expectation.
The natural population object that regression tries to estimate is the average of \(Y_{i}\) within each subpopulation defined by \(X_{i}\).
The conditional expectation \(\mathbb{E}[Y_{i}\mid X_{i}=x]\) is the population mean of \(Y_{i}\) inside the subpopulation where \(X_{i}=x\): \[\mathbb{E}[Y_{i}\mid X_{i}=x]=\sum_{y} y\,Prob(Y_{i}=y\mid X_{i}=x).\]
The conditional expectation is useful as the population target for every regression and local-regression method in this part: the sample conditional means \(\hat{M}_{Y|x}\) from Two Groups, the regressogram bin means, and the locally linear fitted values are all sample estimates of \(\mathbb{E}[Y_{i}\mid X_{i}=x]\). The formula above sums over conditional probabilities for discrete \(X_{i}\); for continuous \(X_{i}\) the conditional expectation function traces a smooth curve indexed by \(x\) (the integral version replaces the sum).
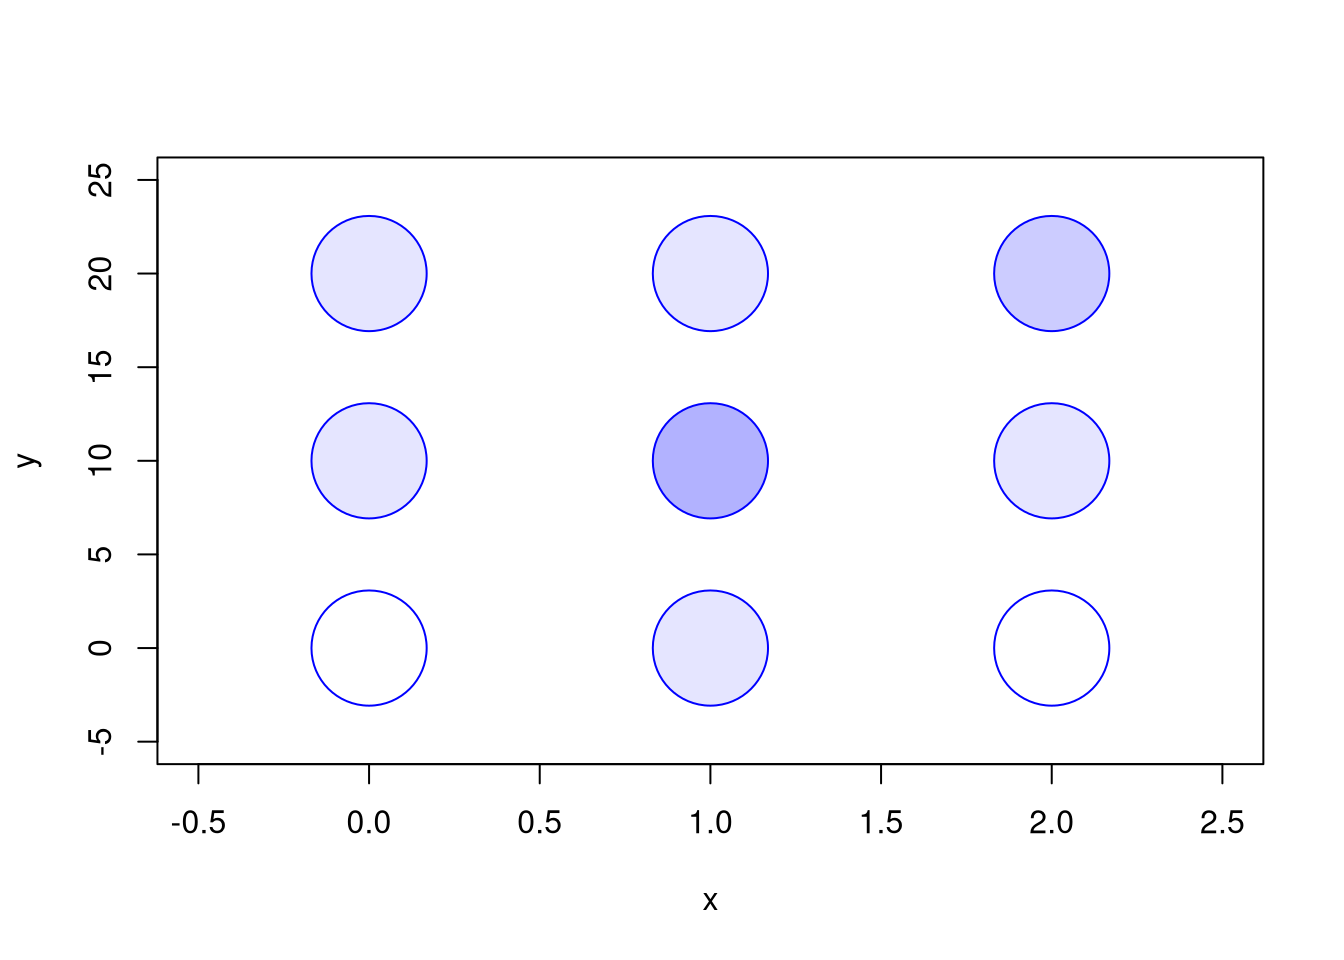
For example, consider a bivariate random vector with three outcomes for \(X_{i}\) and three outcomes for \(Y_{i}\).
| \(y=0\) |
\(0.0\) |
\(0.1\) |
\(0.0\) |
| \(y=10\) |
\(0.1\) |
\(0.3\) |
\(0.1\) |
| \(y=20\) |
\(0.1\) |
\(0.1\) |
\(0.2\) |
The plot below shows each outcome \((x,y)\) with deeper colors reflecting higher probability events.
Code
# Make a Probability Table
x <- c(0, 1, 2)
y <- c(0, 10, 20)
P_xy <- matrix(c(
    0.0, 0.1, 0.0,
    0.1, 0.3, 0.1,
    0.1, 0.1, 0.2
), nrow=3, ncol=3, byrow=TRUE)
rownames(P_xy) <- paste0('y=', y)
colnames(P_xy) <-  paste0('x=', x)
P_xy
##      x=0 x=1 x=2
## y=0  0.0 0.1 0.0
## y=10 0.1 0.3 0.1
## y=20 0.1 0.1 0.2

# Plot joint distribution
prob_table <- expand.grid(x=x, y=y)
prob_table[, 'probabilities'] <- as.vector(t(P_xy))
plot(prob_table[, 'x'], prob_table[, 'y'],
     xlim=c(-0.5, 2.5), ylim=c(-5, 25),
     pch=21, cex=8, col=rgb(0, 0, 1, .8),
     bg=rgb(0, 0, 1, prob_table[, 'probabilities']),
     main=NA, xlab='x', ylab='y')
We can compute marginals from the table, \[\begin{eqnarray}
Prob(X_{i}=0)=0.2,\quad & Prob(X_{i}=1)=0.5 &,\quad Prob(X_{i}=2) = 0.3 \\
Prob(Y_{i}=0)=0.1,\quad & Prob(Y_{i}=10)=0.5 &,\quad Prob(Y_{i}=20) = 0.4
\end{eqnarray}\]
This gives us conditional probabilities and hence also conditional expectations; \[\begin{eqnarray}
\mathbb{E}[Y_i|X_i=0] &=& 0\frac{0}{0.2} + 10\frac{0.1}{0.2} + 20\frac{0.1}{0.2} = 0 + \frac{10}{2} + \frac{20}{2} = 15,\\
\mathbb{E}[Y_i|X_i=1] &=& 0\frac{0.1}{0.5} + 10\frac{0.3}{0.5} + 20\frac{0.1}{0.5} = 0 + \frac{30}{5} + \frac{20}{5} = 10,\\
\mathbb{E}[Y_i|X_i=2] &=& 0\frac{0}{0.3} + 10\frac{0.1}{0.3} + 20\frac{0.2}{0.3} = 0 + \frac{10}{3} + \frac{40}{3} = \frac{50}{3} \approx 16.67.
\end{eqnarray}\] Note that the conditional mean is non-monotonic: \[\begin{eqnarray}
\frac{\mathbb{E}[Y_i|X_i=1] - \mathbb{E}[Y_i|X_i=0]}{1-0} &=& \frac{10 - 15}{1} = -5,\\
\frac{\mathbb{E}[Y_i|X_i=2] - \mathbb{E}[Y_i|X_i=1]}{2-1} &=& \frac{\frac{50}{3} - 10}{1} = \frac{20}{3} \approx 6.67.
\end{eqnarray}\] It decreases from \(x=0\) to \(x=1\) and then increases from \(x=1\) to \(x=2\).
Code
# Compute Marginals
P_x <- colSums(P_xy) #Prob(X_i=x)
P_y <- rowSums(P_xy) #Prob(Y_i=y)

# Compute the conditional probabilities Prob(Y_i=y | X_i=x).
PY_x <- matrix(0, nrow = 3, ncol = 3)
for (j in seq(ncol(P_xy)) ) {
  PY_x[, j] <- P_xy[, j] / P_x[j]
}
rownames(PY_x) <- paste0('Y=', y)
colnames(PY_x) <- paste0('given X=', x)
PY_x
##      given X=0 given X=1 given X=2
## Y=0        0.0       0.2 0.0000000
## Y=10       0.5       0.6 0.3333333
## Y=20       0.5       0.2 0.6666667

# Computational Shortcut: PY_x <- t( t(P_xy) / P_x )

# Conditional expectation E[Y_i|X_i=x]
EY_x <- colSums(PY_x * y)
EY_x
## given X=0 given X=1 given X=2
##  15.00000  10.00000  16.66667

# Contrast with Grand Means
EX <- sum(x * P_x)
EY <- sum(y * P_y)
EY
## [1] 13

# E[X_i|Y_i=y]
# PX_y <- P_xy / P_y  #Prob(X_i=x | Y_i=y)
# EX_y <- colSums(PX_y * x)
Covariance.
We can also dig a little deeper into the other bivariate statistics we compute. When we know how the data are generated, we can often compute the foundational covariance statistic. Referring to and \(\mu_{X}=\mathbb{E}[X_{i}]\) and \(\mu_{Y}=\mathbb{E}[Y_{i}]\), we have \[\begin{eqnarray}
\mathbb{C}[X_{i}, Y_{i}]
&=& \mathbb{E}[(X_{i} – \mu_{X})(Y_{i} – \mu_{Y}])]
= \sum_{x}\sum_{y} (x – \mu_{X})(y – \mu_{Y}) Prob(X_{i} = x, Y_{i} = y)
\end{eqnarray}\]
Using the marginal distributions from before allows us to compute the means: \[\begin{eqnarray}
\mathbb{E}[X_{i}] &=& 0(0.2)+1(0.5)+2(0.3) = 1.1 \\
\mathbb{E}[Y_{i}] &=& 0(0.1)+10(0.5)+20(0.4) = 13
\end{eqnarray}\] We can then compute the cell-by-cell contributions: \(Prob(X_{i} = x, Y_{i} = y) (x-\mathbb{E}[X_{i}])(y-\mathbb{E}[Y_{i}])\), which lead plug in to the covariance formula; \[\begin{eqnarray}
\begin{array}{l l r r r r r}
\hline
x & y & Prob(X_{i}=x, Y_{i}=y) & x-\mathbb{E}[X_{i}] & y-\mathbb{E}[Y_{i}] & (x-\mathbb{E}[X_{i}])(y-\mathbb{E}[Y_{i}]) & \text{Contribution}\\
\hline
0 & 0 & 0.0 & -1.1 & -13 & 14.3 & 0\\
0 & 10 & 0.1 & -1.1 & -3 & 3.3 & 0.330\\
0 & 20 & 0.1 & -1.1 & 7 & -7.7 & -0.770\\
1 & 0 & 0.1 & -0.1 & -13 & 1.3 & 0.130\\
1 & 10 & 0.3 & -0.1 & -3 & 0.3 & 0.090\\
1 & 20 & 0.1 & -0.1 & 7 & -0.7 & -0.070\\
2 & 0 & 0.0 & 0.9 & -13 & -11.7 & 0\\
2 & 10 & 0.1 & 0.9 & -3 & -2.7 & -0.270\\
2 & 20 & 0.2 & 0.9 & 7 & 6.3 & 1.260\\
\hline
\end{array}
\end{eqnarray}\] \[\begin{eqnarray}
\mathbb{C}[X_{i},Y_{i}] &=& \sum_{x} \sum_{y} \left(x-\mathbb{E}[X_{i}]\right)\left(y-\mathbb{E}[Y_{i}]\right) Prob\left(X_{i} = x, Y_{i} = y\right) \\
&=& 0 + 0.330 -0.770 + 0.130 + 0.090 -0.070 +0 -0.270 + 1.260
= 0.7
\end{eqnarray}\]
Correlation.
We can now compute the often-used Pearson correlation: \[\begin{eqnarray}
\frac{\mathbb{C}[X_{i}, Y_{i}] }{ \sqrt{\mathbb{V}[X_{i}]} \sqrt{\mathbb{V}[Y_{i}]} }
\end{eqnarray}\]
To compute this statistic in the previous example, we first need the standard deviations \[\begin{eqnarray}
\mathbb{V}[X_{i}] &=& \sum_{x} (x-\mathbb{E}[X_{i}])^2 Prob(X_{i} = x) \\
&=& (0-1.1)^2(0.2)+(1-1.1)^2(0.5)+(2-1.1)^2(0.3)=0.49 \\
\mathbb{V}[Y_{i}] &=& \sum_{y} (y-\mathbb{E}[Y_{i}])^2 Prob(Y_{i} = y) \\
&=& (0-13)^2(0.1)+(10-13)^2(0.5)+(20-13)^2(0.4)=41 \\
\end{eqnarray}\] Then we can find the correlation as \[\begin{eqnarray}
\frac{\mathbb{C}[X_{i},Y_{i}]}{ \sqrt{\mathbb{V}[X_{i}]} \sqrt{\mathbb{V}[Y_{i}]} }
&=& \frac{0.7}{\sqrt{0.49} \sqrt{41}} \approx 0.156,
\end{eqnarray}\] which suggests a weak positive association between the variables.
Note that you can do all of the above calculations using the computer instead of by hand.
Code
# Compute Covariance
dxy_grid <- expand.grid(dy=y-EY, dx=x-EX)[, c(2, 1)]
dxy_grid[, 'p'] <- as.vector(P_xy)
dxy_grid[, 'contribution'] <- dxy_grid[, 'dx'] * dxy_grid[, 'dy'] * dxy_grid[, 'p']
CovXY <- sum(dxy_grid[, 'contribution'])
CovXY
## [1] 0.7

# Compute Variances
VX <- sum( (x-EX)^2 * P_x)
SX <- sqrt(VX)
VY <- sum( (y-EY)^2 * P_y)
SY <- sqrt(VY)

# Compute Correlation
CorXY <- CovXY / (SX * SY)
CorXY
## [1] 0.1561738
Compute the correlation for bivariate data with these probabilities, using both math (first) and the computer (second)
| \(y=0\) |
\(0.05\) |
\(0.20\) |
| \(y=1\) |
\(0.05\) |
\(0.20\) |
| \(y=2\) |
\(0.05\) |
\(0.20\) |
| \(y=3\) |
\(0.05\) |
\(0.20\) |
Also compute the correlation for bivariate data with these probabilities
| \(y=0\) |
\(0.05\) |
\(0.05\) |
| \(y=1\) |
\(0.10\) |
\(0.10\) |
| \(y=2\) |
\(0.15\) |
\(0.15\) |
| \(y=3\) |
\(0.20\) |
\(0.20\) |
Also compute the correlation for bivariate data with these probabilities
| \(y=0\) |
\(0.05\) |
\(0.15\) |
| \(y=1\) |
\(0.05\) |
\(0.15\) |
| \(y=2\) |
\(0.10\) |
\(0.20\) |
| \(y=3\) |
\(0.10\) |
\(0.20\) |
Explain intuitively when the correlation equals \(0\) and when it does not.
Regression Coefficient.
Just as the sample slope \(\hat{b}_{1}\) summarized a sample, its population counterpart summarizes a random vector.
The (theoretical) regression coefficient \(\beta_{1}\) is the slope of the best straight-line approximation to the conditional expectation in the population: \[\beta_{1} = \frac{\mathbb{C}[X_{i}, Y_{i}] }{ \mathbb{V}[X_{i}] }.\]
\(\beta_{1}\) is useful as the population target of the sample slope \(\hat{b}_{1} = \hat{C}_{XY}/\hat{V}_{X}\) from Simple Regression: OLS estimates \(\beta_{1}\) from a finite sample. The line is “best” in the sense that it minimizes mean squared error among all linear approximations to the conditional expectation function, but when that function bends, the best line still misses.
For the \(3\times3\) table above, we already found \(\mathbb{C}[X_{i}, Y_{i}] = 0.7\) and \(\mathbb{V}[X_{i}] = 0.49\), so \[\begin{eqnarray}
\beta_{1} = \frac{0.7}{0.49} \approx 1.43.
\end{eqnarray}\] This is positive even though the conditional expectation computed earlier is non-monotonic (it falls from \(x=0\) to \(x=1\), then rises). The line captures the overall upward tendency but misses the dip.
Code
# Regression coefficient: covariance over variance of X
CovXY / VX
## [1] 1.428571
Exercises
Comment the script you wrote for this chapter, then restart R and check that it runs from a clean session, then check the script with AI as explained in Working with AI. Write three sentences from memory on the main statistical idea of this chapter, and ask the assistant what is wrong, vague, or missing. Finish with your own questions about whatever you found hardest.
Two joint distributions can have identical marginal distributions but different conditional distributions. Construct a \(2 \times 2\) probability table where \(Prob(X_{i}=0) = Prob(X_{i}=1) = 1/2\) and \(Prob(Y_{i}=0) = Prob(Y_{i}=1) = 1/2\), but the variables are not independent. Verify by checking whether \(Prob(X_{i}=x, Y_{i}=y) = Prob(X_{i}=x)Prob(Y_{i}=y)\) holds.
Consider a bivariate random vector with the following joint distribution:
| \(y=0\) |
\(0.1\) |
\(0.2\) |
\(0.1\) |
| \(y=5\) |
\(0.1\) |
\(0.1\) |
\(0.2\) |
| \(y=10\) |
\(0.0\) |
\(0.1\) |
\(0.1\) |
Compute \(\mathbb{E}[Y_{i}|X_{i}=x]\) for each value of \(x\). Then compute \(\mathbb{C}[X_{i}, Y_{i}]\) and the Pearson correlation.
Write R code to simulate \(N = 5000\) draws from a bivariate normal distribution with means \(\mu_{X} = 0\), \(\mu_{Y} = 5\), variances \(\sigma_{X}^2 = 4\), \(\sigma_{Y}^2 = 1\), and correlation \(\rho = 0.6\). Plot the draws as a scatterplot and verify that the sample correlation is close to \(0.6\).
Recall
This chapter formalized the bivariate-probability counterparts of every empirical object from Part 2: joint, marginal, and conditional distributions; the bivariate normal; conditional expectation \(\mathbb{E}[Y_{i}\mid X_{i}=x]\); theoretical covariance \(\mathbb{C}[X_{i}, Y_{i}]\); theoretical correlation; and the population regression coefficient \(\beta_{1}\). The \(3\times 3\) worked example with \(Prob(X_{i}=x, Y_{i}=y)\) across \(x\in\{0, 1, 2\}\) and \(y\in\{0, 10, 20\}\) produced a non-monotonic conditional expectation (\(\mathbb{E}[Y_{i}|X_{i}=0]=15\), \(\mathbb{E}[Y_{i}|X_{i}=1]=10\), \(\mathbb{E}[Y_{i}|X_{i}=2]\approx 16.67\)) and an upward population regression slope \(\beta_{1}\approx 1.43\), illustrating exactly the gap between \(\mathbb{E}[Y_{i}\mid X_{i}=x]\) and its best linear approximation. The next chapter uses these population objects to build hypothesis tests with known sampling distributions and to interpret rejections through Bayes’ theorem.